
Digitalization has changed the way people shop for the items on their shopping lists. Even groceries are sold online and delivered in no time. Thus, the eCommerce sector is currently thriving and ever-evolving.
With the rapid growth, increase in mCommerce, and global expansion, a lot is happening in the industry.
Whether you are going to start an e-commerce business or expand the already existing one, knowing eCommerce statistics will help you grow your online business to another level. So, here are all the crucial eCommerce industry statistics you need to know about.
E-commerce Industry Statistics (Key Findings)
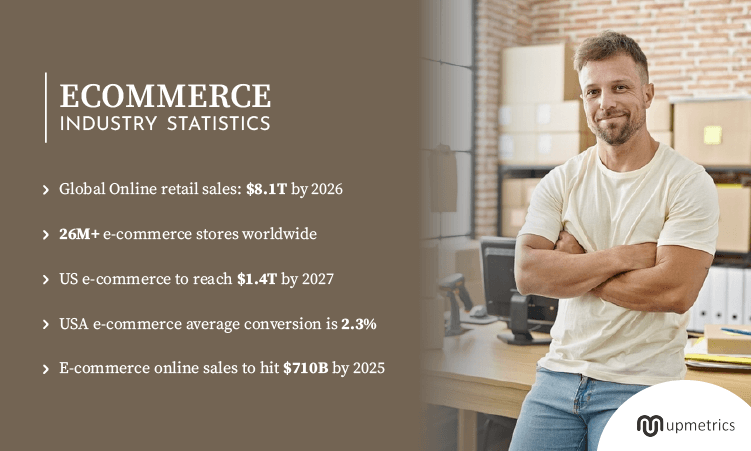
- Global retail online sales are expected to reach $8.1 trillion by 2026.
- There are over 26 million eCommerce stores in total.
- In 2023, there are 2.64 billion digital buyers, accounting for 33.3% of the global population.
- The United States ecommerce industry is projected to increase from $925 billion to $1,415 billion from 2023 to 2027.
- In 2022, the consumer electronics sector generated over $988.4 billion in revenue, surpassing the fashion industry.
- The average conversion of the eCommerce sector in the USA is 2.3%.
- M-commerce total online sales are forecasted to nearly double, reaching around $710 billion by 2025.
General Ecommerce Industry Statistics
This section provides global eCommerce growth predictions, sales forecasts, leading countries, and segments in the eCommerce market. These general statistics will help everyone to understand the industry better.
1. E-commerce sales likely to increase by 56%(source)
Global retail online sales were around $5.2 trillion U.S. dollars in 2021 and are expected to increase by 56% in the coming years, reaching approximately $8.1 trillion by 2026.
2. 2.64 billion online shoppers in the world (source)
In 2023, there are 2.64 billion digital buyers, accounting for 33.3% of the global population. It means that one in every three people prefers to shop online.
The number of online shoppers has been increasing ever since the start. In 2023, there will be 80 million more digital buyers than in 2022, marking a 3.1% year-over-year growth.
3. 3/4th of Americans buy things online(source)
In the USA, lots of people now shop online. More than three-quarters of Americans buy things on the internet. And it’s going to become even more popular as online retail sales in the USA and worldwide will grow by almost 11% from 2023 to 2027.
4. Worldwide eCommerce sales (source)
In 2021, global retail eCommerce sales were about 5.2 trillion U.S. dollars. It’s expected to grow by 56% in the next few years, reaching 8.1 trillion dollars by 2026.
5. US eCommerce revenue – the $900 billion+ club (source)
The United States eCommerce sector is projected to experience stable growth from 2023 to 2027, increasing from $925 billion to $1,415 billion, representing a 53% increment.
Related Ecommerce Resources
6. Electronics lead the eCommerce industry amounting to $988.4 billion (source)
In 2022, the consumer electronics sector took the lead in the global eCommerce sector by generating over $988.4 billion in revenue. This surpassed the fashion industry, which had held the top spot in 2021.
While the fashion industry ranked second, it still generated an impressive $904.5 billion in revenue. Additionally, the food and beverages sectors are experiencing the fastest growth, with a remarkable 38% and 35% increase in revenue, respectively. (Source)
| Annual spend in each consumer goods e-commerce category of 2022 | |
|---|---|
| Electronics | $988.4 billion |
| Fashion | $904.5 billion |
| Furniture | $436.8 billion |
| Toys/hobby/DIY | $392.9 billion |
| Personal & household care | $381.5 billion |
| Food | $376.6 billion |
| Beverages | $211.5 billion |
| Physical media | $155 billion |
7. China leads the industry, followed by the United States.
Approximately 80% of internet users in China shop online, making a significant contribution to global retail eCommerce sales due to its substantial population share of 18.47%.
Total e-commerce sales in China are $3,023.66 billion and the United States accounts for $1,163.49 billion as of 2023. (source)
8. 2.6 million total online stores globally (source)
There are a total of 26,780,716 eCommerce stores on the entire Internet as of September 2023. Out of which 26% of online retailers are on Shopify.
| Distribution for websites using eCommerce technologies | |
|---|---|
| Shopify | 26% |
| WooCommerce checkout | 19% |
| Wix stores | 16% |
| Squarespace add to cart | 11% |
| Ecwid | 5% |
| Others | 23% |
Mobile Commerce Statistics
Mobile devices are a wonderful way to convert your visitors into existing customers. Mobile commerce presents a wealth of opportunities for eCommerce markets to boost brand recognition.
Discover the top mobile Commerce statistics and learn how to leverage them to sway mobile buying choices.
1. M-commerce crossed $360 billion and is still increasing (source)
In 2021, mCommerce sales in the United States surpassed $360 billion. Forecasts indicate that by 2025, this number is expected to nearly double, reaching approximately $710 billion.
2. M-commerce sales share in eCommerce (source)
Mobile e-commerce sales surged to an astonishing $2.2 trillion globally, covering a whopping 60% of the entire e-commerce. There is a commendable growth in mCommerce; rising from 56% in 2018 to an expected 62% by 2027 worldwide.
3. People between 18 to 34 are using mCommerce the most (source)
The majority of shoppers, especially those between 18 and 34 years old, prefer using smartphones for mobile shopping instead of tablets. However, it’s not just the younger crowd; older online shoppers also embrace mobile commerce. Over 20% of online shoppers aged 50 to 64 use mobile for shopping at least once a week.
4. Amazon is the most downloaded shopping app (source)
Retailers are mostly benefitting from mobile shopping apps, and people like using them. The most popular shopping app in the US in 2022 was Amazon with 35 million downloads.
The second most downloaded shopping app is Shein, and it is famous for buying fashionable clothes and beauty products.
5. Distribution of mobile shoppers based on their income (source)
In March 2023, mobile user data based on location showed that the biggest group of US mCommerce shoppers had a household income below $25,000, making up 34.9% of shoppers. The second-largest group, accounting for 17.7% of shoppers, had a household income between $40,000 and $59,999.
Ecommerce Marketing Statistics
Due to the pandemic, everyone has understood the importance of eCommerce, thus the competition is increasing in the eCommerce sector. Therefore, marketing is an essential part of the business, and here are some insightful eCommerce statistics for marketing:
1. Loyalty programs influence 83% of customers’ decisions to repurchase (source)
83% of customers say loyalty programs affect their buying choices. Increasing customer retention by just 5% can raise any business’s revenue by at least 25% because 42% of consumers spend more on brands they’re loyal to.
However, it’s important to note that 79% of consumers are no longer interested in accumulating points. If you’re considering a loyalty program, think about offering instant rewards instead.
2. 91% of businesses focus on video (source)
Video is a big deal in marketing. 91% of businesses use it to promote their stuff. Almost all marketers, 96% to be exact, think video is super important for their marketing plans.
Here are the types of videos they make:
- 66% use real-life videos.
- 57% make videos on their computer screens.
- 55% create animated videos.
54% of customers want more videos from the businesses they like. So, if you make short videos about your stuff, you won’t have to rely on online ads so much to acquire or retain customers.
3. Product photography is important (source)
75% of people who do online shopping rely on product photos while deciding on a potential purchase.
4. Personalization is the new norm (source)
51% of marketers have prioritized personalization as their top focus. When companies offer a personalized customer experience, it influences 76% of consumers to make a purchase.
Achieving this personalization in marketing campaigns and shopping experiences hinges on having accurate customer data. Tools like Google Analytics empower eCommerce businesses to track various website statistics, providing valuable insights into customer preferences and shopping behaviors.
Ecommerce Social Media Statistics
With the increasing number of mobile device users, social media has evolved into one of the most effective online marketing channels. Here are some valuable insights into social eCommerce:
1. Omnichannel presence is necessary (source)
Shopping experiences today aren’t straightforward. They involve a mix of social media, mobile apps, email, web browsing, live chat, and much more. Around 75% of American shoppers use their smartphones to find extra info before buying something from online stores.
2. 64.5% of the total population are Social media users (source)
As of the beginning of Q3 2023, approximately 5.19 billion individuals worldwide were connected to the internet, constituting about 64.5% of the global population. It means 9 out of 10 Internet users utilize social media platforms.
Therefore, being present on social media platforms will support your online business in growing its visibility.
3. Social commerce is expected to grow 3 times larger (source)
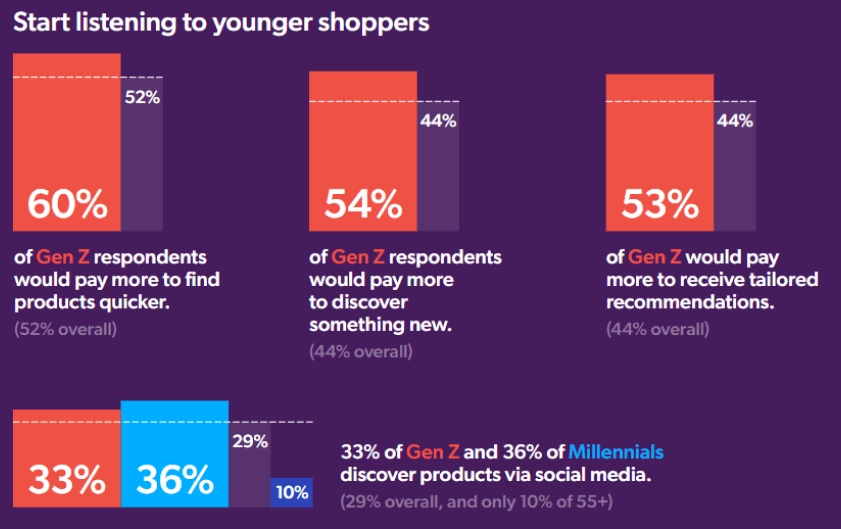
Social commerce is predicted to increase three times faster than traditional commerce, reaching $1.2 trillion by 2025 from $492 billion globally. This growth will be primarily supported by millennials (33%), Gen-Z (29%), Gen-X (28%) and baby boomers (10%).
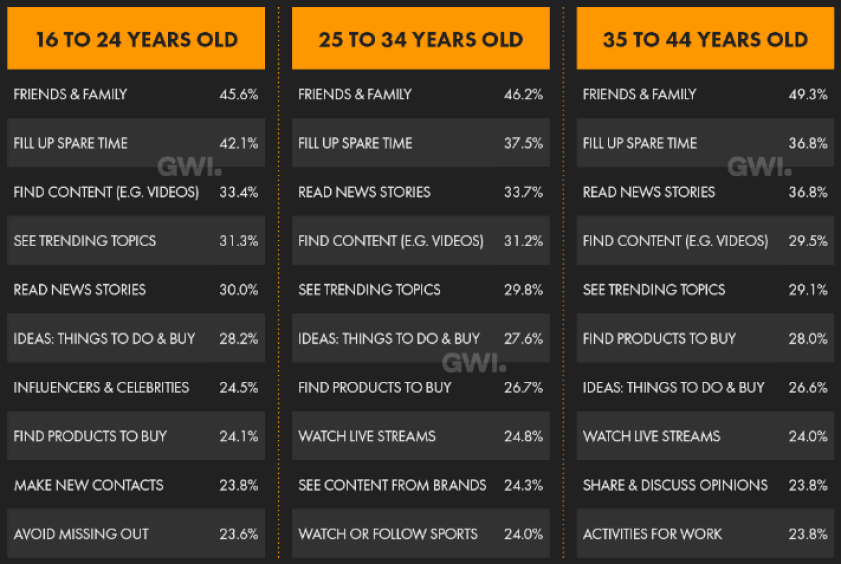
4. Reasons people use social media (source)
To promote online purchases, social media plays a very important role. People between the ages of 16 to 24 are using social media 28% for making purchasing decisions. See below the other age group using social media for shopping.
5. Instagram is the top-hot choice (source)
In the United States itself, the app’s user base reached 128.3 million in 2022. Originally designed for sharing photos with friends, Instagram has transformed into a shopping destination.
With the introduction of features like shops, live streaming, and influencer collaborations, a whopping 92% of online retailers now incorporate Instagram into their social commerce strategies.
ECommerce Conversion Statistics
Understanding the science of conversion is the key to unlocking success. Every click, scroll, and decision made by online shoppers can be a vital piece of the puzzle. Let’s understand it better with these statistics:
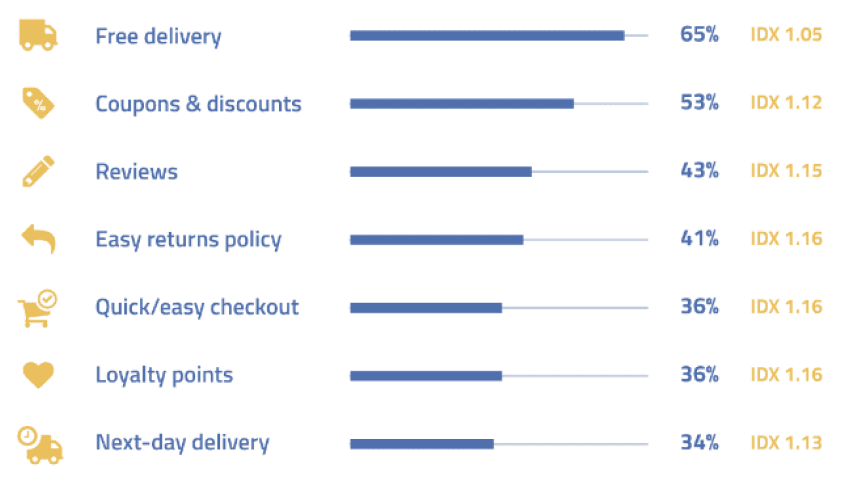
1. Free delivery is the top purchasing driver for online shoppers (source)
The most effective conversion incentive, with a significant lead, is free shipping. According to 65% of shoppers, free delivery would motivate them to make a purchase. Some of the other purchasing drivers are:
2. Free returns affect 40% of customers’ purchasing decisions (source)
Almost 40% of U.S. shoppers said they would probably stop buying from brands if they no longer offered free returns. However, many American consumers had concerns about how free returns might impact purchasing decisions.
3. Average conversion rate in the United States (source)
Based on the most recent information available in August 2023, the average conversion rates for online shopping stood at 2.03%. This is a notable rise of 0.39% from the same time last year.
Online Shopping Behavior Statistics
Knowing how people shop online and what they like is essential for your online store’s success. It makes the shopping experience better and increases your total retail sales. Here are some important eCommerce insights about how people shop online:
1. The online shopping experience is better than a physical store (source)
A whopping 93% of online shoppers expect a superior shopping experience when using e-commerce websites and mobile apps compared to shopping in a physical store.
2. Start paying more attention to younger generations (source)
The younger generation is 52% more likely to pay more if they are getting the exact thing they want from mobile websites. Therefore, target them and understand their needs.
3. Cart abandonment ratio is 70% (source)
70% of online shoppers desert their shopping carts before completing their purchases. Hence, knowing consumer behavior is important to stop that abandonment ratio.
| Annual spend in each consumer goods eCommerce category of 2022 | |
|---|---|
| Extra costs too high (shipping, taxes, fees) | 47% |
| The site wanted me to create an account | 25% |
| Delivery was too slow | 24% |
| I didn’t trust the site with my credit card information | 19% |
| Complicated or long checkout process | 18% |
| I couldn’t see/calculate the total order cost upfront | 17% |
| The return policy wasn’t satisfactory | 16% |
| Website had errors | 14% |
| There weren’t enough payment options | 11% |
| The credit card was declined | 6% |
4. Live chat support encourages people to buy (Source)
51%, prefer eCommerce businesses with live chat support.
However, many, 40%, don’t expect fast and high-quality support through live chat. A whopping 84% have abandoned live chat due to slow responses.
| People’s preference for live chat | |
|---|---|
| Customers value thorough, high-quality support more than speed | 95% |
| Consumers are more likely to remain loyal to a company that offers live chat support | 52% |
| Customers haven’t had a positive live chat experience in recent times | 47% |
Ecommerce Payment Statistics
In the age of digitalization, online transactions have become the new norm. Understand the evolving landscape of online payments and consumers behavior around it:
1. Mobile wallets are gaining popularity (source)
In 2022, mobile wallets dominated the global e-commerce payment landscape, covering around 50% of all online transactions, and dominating as the most preferred method globally. This share is predicted to grow 54% by 2026.
2. 9 in 10 Americans are using digital payments (source)
Not only did digital payment methods reach a remarkable 89% adoption rate in 2022, but what’s truly fascinating is the surge in folks who are embracing not just one, but multiple digital payment options.
3. Top digital wallets in the US – PayPal leads the way (source)
PayPal is the most used mobile wallet accounting for 69% of users. GooglePay (56%), Apple Pay (53%), and Samsung Pay (52%) are also some popular picks of Americans.
4. Global eCommerce payment market (source)
The worldwide eCommerce payment market reached a worth of $1,175,298.39 million in 2022. It is expected to grow at a rate of 10.06%, reaching $2,088,762.24 million by 2028.
Ecommerce Security Statistics
With the constant increase in digitalization, there is an increase in threats and attacks too. Let’s see the statistics of the security for eCommerce:
1. Automated attacks (source)
Attacks on internet merchants were automated in 62% of cases. The top three geographical areas for malicious bot attacks on retail websites were America, Europe, and Asia Pacific.
2. Buy now, pay later fraud trend is high (source)
The global Buy Now, Pay Later (BNPL) market was worth $90.69 billion in 2020 and is expected to reach $3.98 trillion by 2030. However, this rise in popularity has also led to increased online fraud, mainly identity fraud.
The most common form of such fraud involves taking over existing BNPL accounts for unauthorized purchases. There was a significant 58% month-over-month growth in account takeover attacks targeting financial services in May 2022.
3. North & South America is the target (source)
When it comes to retail websites, 43.9% of all attacks are directed at North and South America. In contrast, 58.2% of attacks target general websites.
In Europe, 33.7% of attacks are focused on retail websites, while 20.5% of attacks target general websites. Interestingly, Africa experiences more attacks in the general category, where 2.3% of general websites are targeted by security threats.
Conclusion
In today’s fast-paced world of digitalization and online shopping, the eCommerce landscape is crowded and constantly changing. To grow in this dynamic environment, you must keep a watch on the trends of mCommerce, online payments, and security.
This article brings together 35+ such essential eCommerce stats, covering consumer behavior, mobile shopping, social media, and marketing. Happy selling & keep growing!